
Places Insights lets you conduct advanced statistical analysis on Google Maps' rich Places data. It provides aggregated counts and density information for millions of Places-of-Interest (POI) data points, allowing for powerful geospatial intelligence.
Key Capabilities:
- Geospatial Intelligence: Get a "bird's eye view" of the density and distribution of different categories of POIs (e.g., retail, restaurants, services) across specific geographic areas.
- Secure Data Access: The data is deployed using BigQuery data exchange listings with data protections in place, enabling a secure and protected environment for data sharing and analysis.
- Actionable Detail: While Places Insights focuses on aggregate trends, you can use the outputted Place IDs to drill down and retrieve individual Place information using other Google Maps Platform APIs to go from statistical insight to detailed action.
About places data
Google Maps curates places data for millions of establishments worldwide. Places Insights makes this comprehensive places data available in BigQuery so that you can derive aggregated insights about Google Maps' places data based on a variety of attributes such as place types, ratings, store hours, wheelchair accessibility, and more.
To use Places Insights you write SQL queries in BigQuery that returns statistical insights about places data. These insights let you answer questions such as:
- How many similar businesses are operating near a potential new store location?
- What kinds of businesses are most commonly found near my most successful stores?
- What areas have a high concentration of complementary businesses that could attract my target customers?
- How many 5 star sushi restaurants are open at 8pm in Madrid, have wheelchair accessible parking, and offer takeout?
- Which zip codes in California have the highest concentration of EV charging stations?
Places Insights supports multiple use cases, such as:
- Site selection: Evaluate and choose the most suitable locations for a new business or placement of a physical asset. By analyzing the density and mix of surrounding POIs, you can ensure a prospective site is optimally positioned within its competitive and complementary business environment. This data-driven approach can reduce the risk associated with investment in new locations.
- Location performance evaluation: Determine what geospatial variables, such as proximity to certain types of POIs like supermarkets or event venues, correlate with positive or negative performance across your existing locations. This data lets you identify prospective sites that share the best mix of geospatial characteristics for your use case. You can also use this information to deploy predictive models that forecast the future performance of any new locations based on its surrounding POI context..
- Geotargeted marketing: Determine what types of marketing campaigns or advertisements will be successful in an area. Places Insights provides the context needed to understand commercial activity, allowing you to tailor messaging based on the concentration of relevant businesses or activities..
- Sales forecasting: Predict future sales at a prospective location. Modeling the impact of surrounding geospatial characteristics lets you create robust predictive models to drive investment decisions.
- Market research: Inform which geographies to expand your business or service to next. Analyze existing market saturation and POI density to identify underserved or highly concentrated target markets that offer the greatest opportunity. This analysis provides evidence to support strategic growth and expansion initiatives.
You can query Places Insights datasets directly or use Places Count functions.
About brands data
Along with the places data, Places Insights includes data about brands, or stores that have multiple locations that operate under the same brand name.
You can use brands to answer questions such as:
- What is the count of all stores by brand in an area?
- What is the count of my top three competitor brands in the area?
- What is the count of all of the coffee shops excluding these brands in this area?
About BigQuery
By making data available in BigQuery listings, Places Insights lets you:
- Securely combine your data with Places Insights data.
- Write flexible SQL queries to uncover aggregated insights for your specific business needs.
- Use the same BigQuery tools that you are already using with your private data and workflows.
- Harness the power of BigQuery's scale and performance so that you can analyze massive datasets with ease.
Example use case
This example joins your data with Places Insights data in BigQuery to derive aggregation information. For this example, you are a hotel owner in New York City, with multiple locations. You now want to join your hotel location data with Places Insights data to discover the concentration of predefined business types near your hotels.
Prerequisites
For this example, you subscribe to the Places Insights dataset for the United States.
Your hotel dataset is named mydata and defines the locations of your two
hotels in New York City. The following SQL creates this dataset:
CREATE OR REPLACE TABLE `mydata.hotels` ( name STRING, location GEOGRAPHY );
INSERT INTO `mydata.hotels` VALUES( 'Hotel 1', ST_GEOGPOINT(-73.9933, 40.75866) );
INSERT INTO `mydata.hotels` VALUES( 'Hotel 2', ST_GEOGPOINT(-73.977713, 40.752124) );
Get the count of restaurants in the area
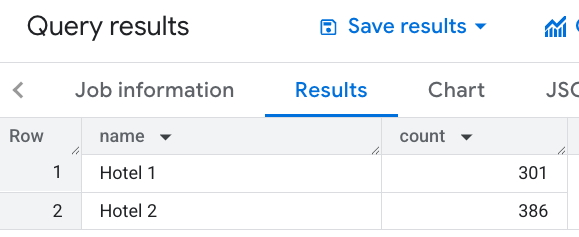
To give your customers an idea of the density of operational restaurants near your hotels, you write a SQL query to return the number of restaurants within 1000 meters of each hotel:
SELECT WITH AGGREGATION_THRESHOLD h.name, COUNT(*) AS count
FROM `PROJECT_NAME.places_insights___us.places` AS r, `mydata.hotels` AS h
WHERE
ST_DWITHIN(h.location, r.point, 1000)
AND r.primary_type = 'restaurant'
AND business_status = "OPERATIONAL"
GROUP BY 1
This image shows an example output to this query:
Use a Places Count function to get the count and Place IDs of restaurants in the area
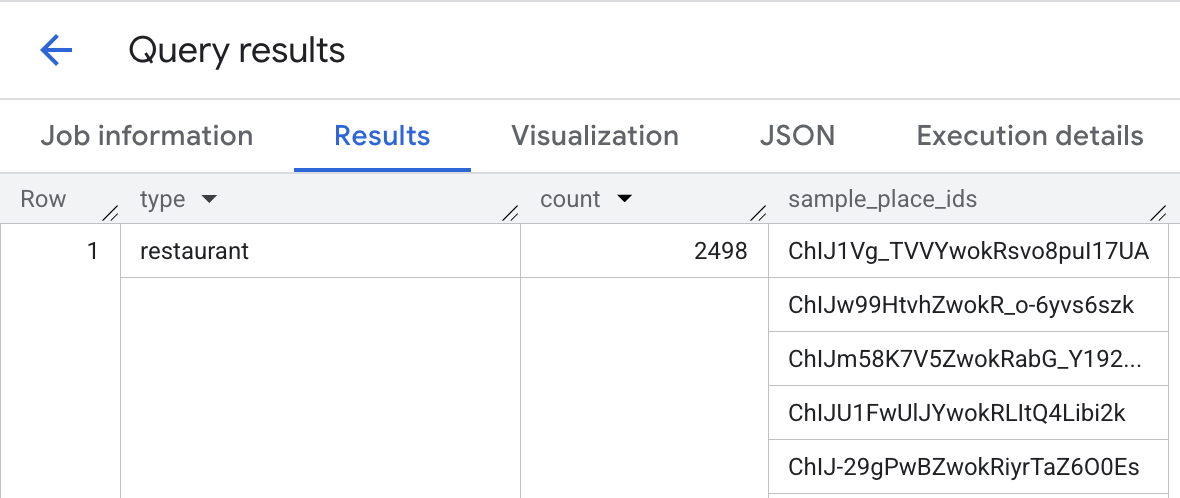
You can also use a Places Count function
to find a count of restaurants near a location. Places Count functions allow you to retrieve a list of Place IDs, which can be used to look up details about the individual places:
DECLARE geo GEOGRAPHY;
SET geo = ST_GEOGPOINT(-73.9933, 40.75866); -- Location of hotel 1

SELECT * FROM `PROJECT_NAME.places_insights___us.PLACES_COUNT_PER_TYPE`(
  JSON_OBJECT(
      'types', ["restaurant", "cafe", "bar"],
      'geography', geo,
      'geography_radius', 1000 -- Radius in meters
      )
);
This image shows an example output to this query:
Get the count of restaurants and bars in the area
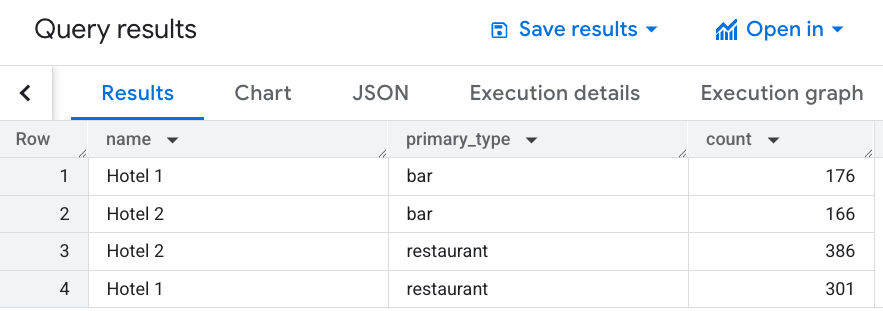
Modify your query to include bars along with restaurants within 1000 meters of each hotel:
SELECT WITH AGGREGATION_THRESHOLD h.name, r.primary_type, COUNT(*) AS count
FROM `PROJECT_NAME.places_insights___us.places` AS r, `mydata.hotels` AS h
WHERE
ST_DWITHIN(h.location, r.point, 1000)
AND r.primary_type IN UNNEST(['restaurant','bar'])
AND business_status = "OPERATIONAL"
GROUP BY 1, 2
This image shows an example output to this query:
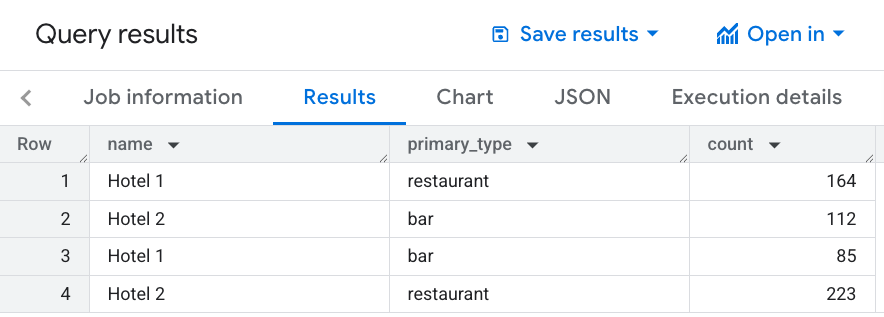
Get the count of moderately priced restaurants and bars in the area
You next want to know which customer demographic is served by the bars and restaurants. Because your hotels target a moderate price point, you only want to advertise the existence of nearby establishments that are at that price point and are well reviewed.
Restrict the query to only return bars and restaurants if they are at the
PRICE_LEVEL_MODERATE price point, and rated 4 stars or above. This query also
extends the radius to 1500 meters around each hotel:
SELECT WITH AGGREGATION_THRESHOLD h.name, r.primary_type, COUNT(*) AS count
FROM `PROJECT_NAME.places_insights___us.places` AS r, `mydata.hotels` AS h
WHERE
ST_DWITHIN(h.location, r.point, 1500)
AND r.primary_type IN UNNEST(['restaurant', 'bar'])
AND rating >= 4
AND business_status = "OPERATIONAL"
AND price_level = 'PRICE_LEVEL_MODERATE'
GROUP BY 1, 2
This image shows an example output to this query:
What's next
- Set up Places Insights
- Query the dataset directly
- Query the dataset using Places Count functions
- View the schema reference